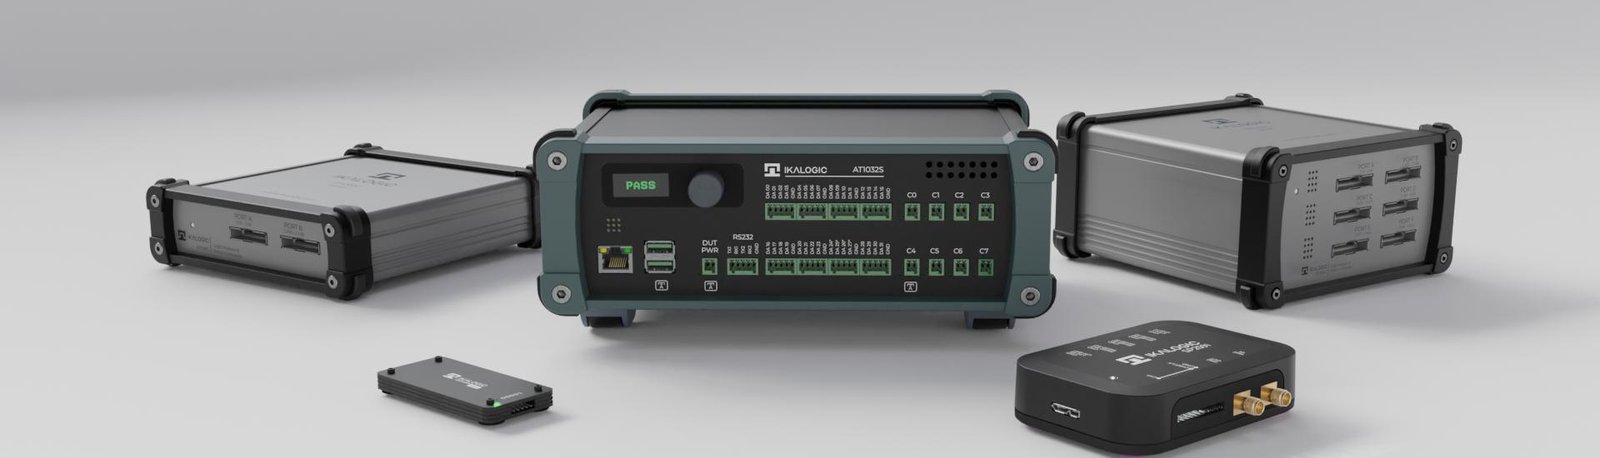
Test & Measurement Instruments
For electronics engineers
From compact logic analyzers to advanced test sequencers, Ikalogic builds high-performance instruments trusted by electronics engineers worldwide.
- Logic Analyzers
- Pattern Generators
- Test Sequencers
- RF Switches
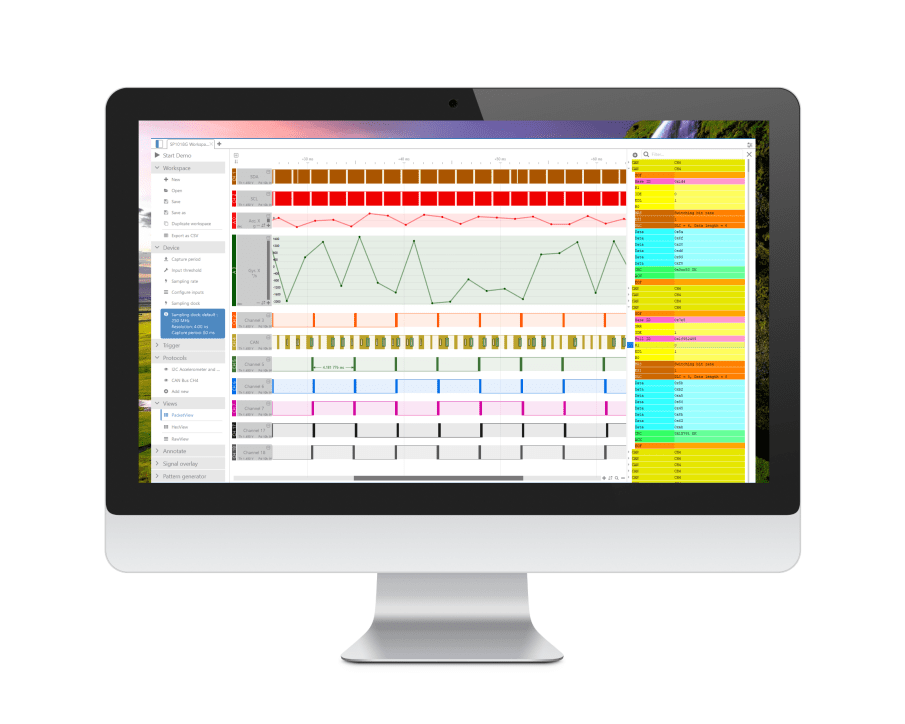
Professional Logic Analyzers for Embedded Engineers.
Capture and decode I²C, SPI, 1-Wire, CAN bus, UART, and more. Set precise triggers, sync with other instruments, and never miss a bit.


Pattern Generators with Built-in Logic Analysis.
Generate and capture digital signals with a single instrument — ideal for semiconductor testing, QA and DFT (Design For Test) workflows.
Automated Functional Testing for PCBs and Products
Streamline PCBA validation using a modern approach to test sequencing. Interface with bed-of-nails or standard connectors, and customize every step with a powerful, scriptable API .


Precision RF Switching, Made Simple
Meet the CS8000 Series – our 8 GHz 2x16 RF switch designed for demanding lab and production environments. With ultra-low insertion loss, USB control, and SMA trigger input for synchronized switching, it’s the perfect tool for RF testing, routing, and automation. Built for engineers who need reliability without the complexity.
This product range is in development and is expected to be available in 2025 Q3.
They trust us
Ikalogic is a trusted partner for leading companies and institutions in the electronics industry.


Inquire about our solutions
Not sure which product fits your needs? Want to explore a custom project? Let’s start the conversation.