Plotting Logic Analyzer data on a graph
Introduction
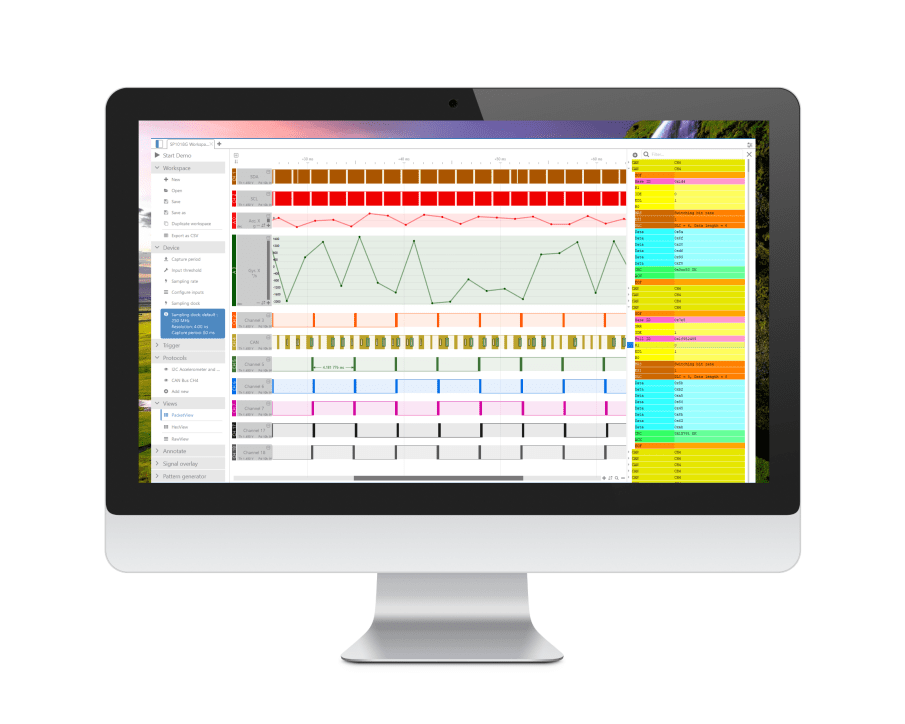
Even if you’re using a logic analyzer to capture logic signals (0’s and 1’s), with ScanaStudio you can also display an analog representation of decoded data using Virtual Analog Channels. They can be useful for plotting Logic Analyzer data on a graph because it’s often the best way to see meaningful information. Suppose you’re looking at the PWM signal driving a motor, or decoding the output of an I2C digital accelerometer, wouldn’t it be nice to see the values plotted on a graph instead of just reading numbers?
In this chapter, we’ll explore the different features that Virtual Analog Channels can offer.
Keep in mind that we don’t - at any moment - capture analog signals like an oscilloscope. VACs (Virtual Analog Channels) are only a graphical representation of data.
How to use them?
Virtual Analog Channels are directly implemented in different protocols you may have already used.
Once a decoder that has the Virtual Analog Channels feature starts decoding data, a new virtual channel is created after the original logic channels.
Note: You may need to scroll down to see the added virtual channels, as they may be hidden depending on your screen size or the number of channels of the logic analyzer device you’re using.
If you right-click on the channel (shaded part on the left of the graph), you can :
- Choose between Log and Decimal scale,
- Change the trace color,
- Modify the display size (min, small, medium, big, max).
At the moment of writing this document, Virtual Analog Channels are implemented for the following protocol decoders :
- I2C - thermometers and humidity, to display both the temperature in °C and the humidity percentage,
- PWM, to display the duty cycle in percent,
- Servomotor, to display the speed or the angle (in deg or percent),
- Parallel bus, to display the data in decimal,
- FM modulation, to display the frequency in Hz.
Adjusting the scale and offset
By default, ScanaStudio will scale each channel to display the full scale of the signal (taking into consideration maximum and minimum values among all available data). However, in some situations, it’s needed to adjust the scale (vertical zoom level) and the offset to see particular details. This can be done using the scroll bar (1) and the zoom in (2) and zoom out (1) buttons (as shown in the image below). Once you zoom in, you can use the scroll bar to adjust the offset according to your needs
Example application
Below is an example application of the virtual analog channels, where an FSK modulation is used to encode binary data (0’s and 1’s). If we look at channel 4 as a logic signal, it’s impossible to visualize the slight frequency changes, however, using the virtual analog channels to plot the frequency on a graph, one can clearly distinguish the two frequencies used for the FSK modulation.
The image below shows captures FM signal on channel 4, along with a plot of the frequency.
Going further
We’re constantly working on adding new features to our Scripts. Please don’t hesitate to [contact us if you have any suggestions or special requests.
If you want to implement your own graphical representation of data and if you’re comfortable with JavaScript, don’t hesitate to take a look at this knowledge base section.